I executed the command jupyter nbconvert --to html notebook.ipynb in order to perform a conversion of a Jupyter Notebook file to the html format.
I executed the command jupyter nbconvert --to markdown notebook.ipynb in order to perform a conversion of a Jupyter Notebook file to the Markdown format. The output of this command, in the form of a Markdown document, was subsequently transferred to this site.
import pyodbc
import pandas as pd
import os
import json
import yaml
with open('creds.yaml', 'r') as file:
   creds = yaml.safe_load(file)
server = creds['usfoodcon']['server']
database = creds['usfoodcon']['database']
username = creds['usfoodcon']['username']
password = creds['usfoodcon']['password']
cnxn = pyodbc.connect('DRIVER={PostgreSQL Unicode};SERVER='+server+';DATABASE='+database+';UID='+username+';PWD='+ password)
cursor = cnxn.cursor()
query = '''SELECT "Country"
, "Commodity"
, "UOM"
, "Category"
, "FoodValue"
, "FoodValue" "DollarValue"
, "YearNum"

FROM us_food_imports
where "Country" NOT IN (
	'REST OF WORLD',
	'WORLD (Quantity)',
	'WORLD'
)
and (
	"Category" ILIKE 'Meats'
	or "Category" ILIKE 'Animals'
)
and "YearNum" = 2021
order by "Country"
;
'''
df = pd.read_sql(query, cnxn)
print(df.head(10))
     Country                          Commodity        UOM Category  \
0  AUSTRALIA         Frozen red meats and parts  Million $    Meats
1  AUSTRALIA         Fresh or chilled red meats  Million $    Meats
2  AUSTRALIA  Total red meats, fresh and frozen  Million $    Meats
3     BRAZIL  Total red meats, fresh and frozen  Million $    Meats
4     BRAZIL                     Prepared meats  Million $    Meats
5     BRAZIL         Frozen red meats and parts  Million $    Meats
6     CANADA                          Bird eggs  Million $  Animals
7     CANADA                     Prepared meats  Million $    Meats
8     CANADA               Fowl and other meats  Million $    Meats
9     CANADA  Total red meats, fresh and frozen  Million $    Meats

   FoodValue  DollarValue  YearNum
0      650.4        650.4     2021
1      649.3        649.3     2021
2     2304.1       2304.1     2021
3      365.0        365.0     2021
4      496.2        496.2     2021
5      355.5        355.5     2021
6       46.2         46.2     2021
7      653.4        653.4     2021
8      125.3        125.3     2021
9     3495.2       3495.2     2021
import matplotlib.pyplot as plt
# Prepare the data
commodities = df['Commodity'].unique()
countries = df['Country'].unique()
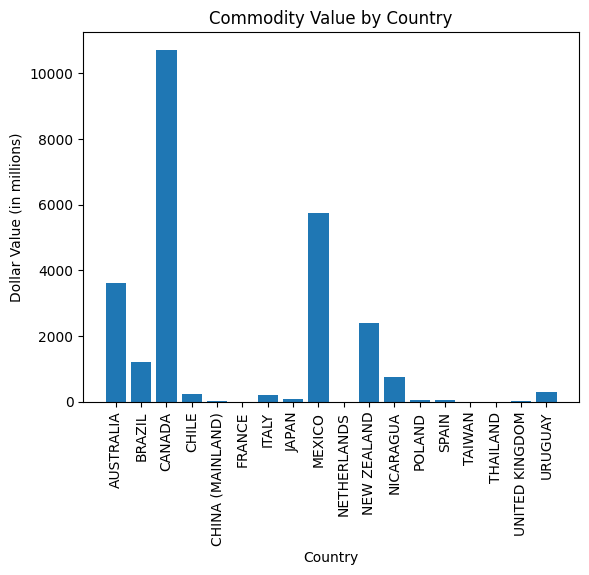
dollar_values = df.groupby('Country')['DollarValue'].sum().values
# Plot the data
plt.bar(countries, dollar_values)
plt.xlabel('Country')
plt.ylabel('Dollar Value (in millions)')
plt.title('US Imported Commodity Value by Country')
plt.xticks(rotation=90)
plt.show()
cursor.close()
cnxn.close()