Read Part 1!
Analyzing Sleep with Google Location Data
After successfully extracting and cleaning CPAP data, the next step was to bring in outside data to aid in the analysis. The two thoughts I had for external data were location data and weather data. I decided to start with location data since it would be used to determine the weather at the location.
Google offered a service to request personal data called Takeouts. I then shifted focus on learning how to read the json provided in the .zip file that was generated.
Parsing Location Data with Python
The first step was to obtain the location data from Google Takeout. This data is in two formats, raw location history data and semantic location history data. The raw location history data is found in the Records.json file and contains a single flat locations array with all the location records. Each record contains the following fields:
- timestamp in ISO 8601 format (YYYY-MM-DDTHH:mm:ss.sssZ) with Z indicating UTC time zone
- latitudeE7 and longitudeE7 as integers that need to be divided by 107
The semantic location history data is found in the Semantic Location History folder and is processed and partitioned by year and month in different JSON files. Inside each semantic JSON file is a single flat timelineObjects array.
To extract the necessary information from the location data, a Python script was created to parse the data and store it in a csv file. The script extracts the timestamp, address, placeId, name, latitudeE7 and longitudeE7 values from the raw and semantic location history data. The resulting csv file can then be used in ArcGIS for spatial analysis and visualization. Running the Location History Parser
To use the Python script, follow these steps:
- Download and extract your Location History data from Google Takeout
- Save the script in the same folder as your Location History data
- Open a terminal/command prompt and navigate to the location of the script and data
- Run the script using the command python location_history_parser.py
- The resulting csv file will be saved in the same folder as the script and data with the name location_history.csv
I then use my csvtable.py script to upload this location data into my CPAP database.
Visualizing the Data
Using the location data I was able to perform a quick analysis to see how many places I visited in a given day that I traveled.
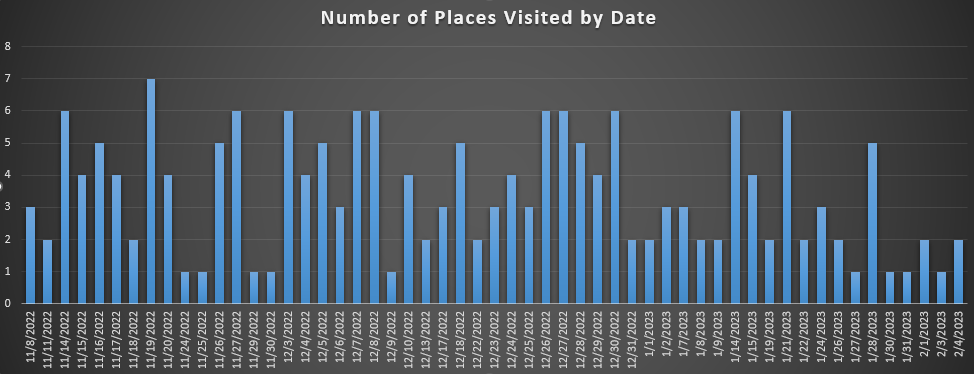
Places Visited
I also found it fun to create a heat map of my travels.
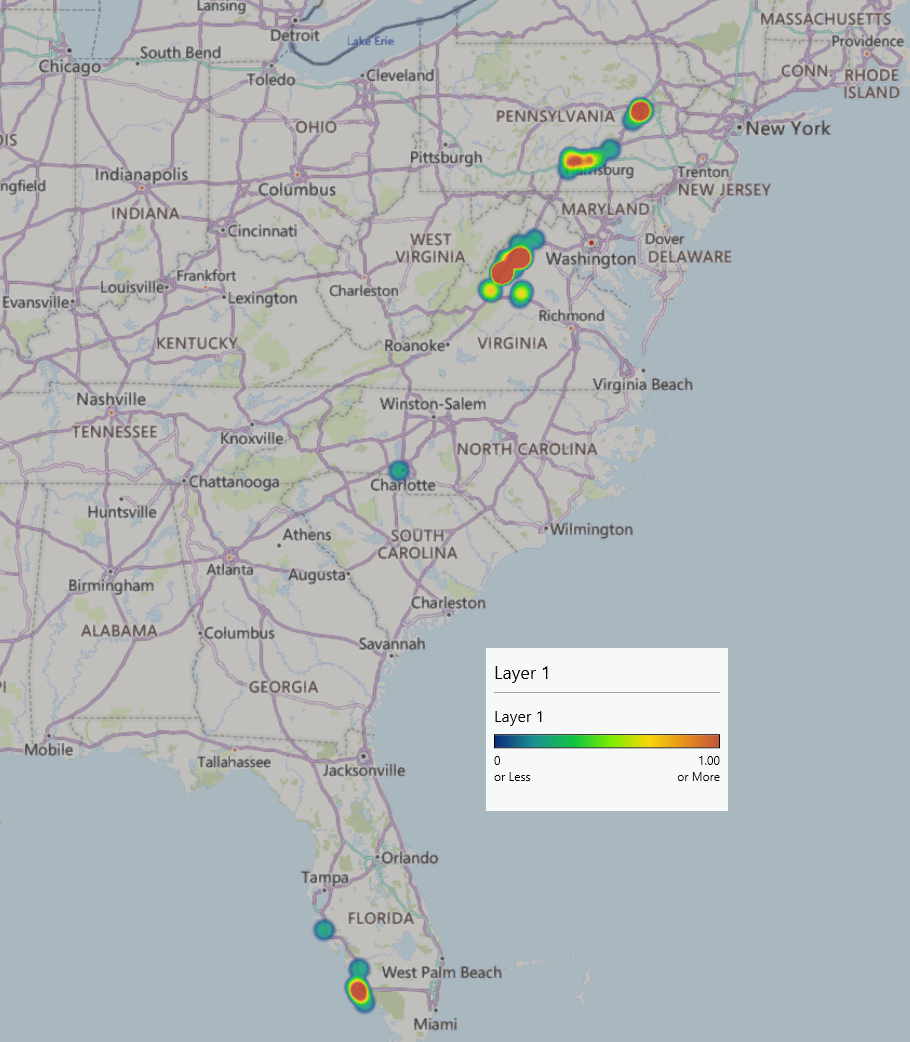
Places Visited Heat Map