Read Part 2!
Analyzing Sleep with Google Location Data
With my location data collected in the previous part, it was time to find the weather for the places where I slept each day. I discovered a free API called Meteostat that provided weather data for specific locations and times, so I signed up for an API key and tested it with a few of my Google location data samples.
With my Google location data and the API key in hand, I started writing a Python script to extract the weather data for each location and time.
Coding the Weather Data Extractor
The code uses the Meteostat API and Google location data to extract weather information. The necessary libraries - requests, pandas, time, and csv - are imported first. The API endpoint and headers containing the API key and host are defined.
The Google location data is then loaded into a Pandas DataFrame, and a header row for the weather data is created. A CSV file named “weather_data.csv” is created, and the header row is written to the file.
The script loops through each row in the Google location data DataFrame, formatting the date for use in the API query. The API request is made with the latitude, longitude, start date, and end date as parameters, and the response is parsed into a dictionary.
For each data record in the response, the values are added to a list and written as a new row in the “weather_data.csv” file. The loop continues through all rows in the Google location data DataFrame, with a sleep of 0.5 seconds between each API request. This sleep was added due to the free version of the API limiting calls to 3 per second. The date and name of each location are printed during each iteration of the loop, along with the epoch timestamp, which serves as a unique identifier for joining this weather data table with the location data table.
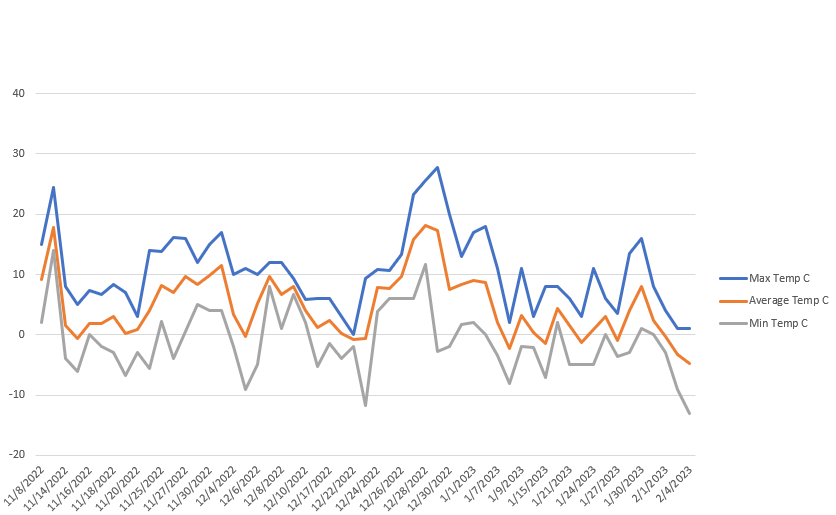
Here is a line chart of the temperatures I experienced, generated using the data collected by the API.
I then used my CSV to table script to upload the “weather_data.csv” file into my PostgreSQL database.