The Disk That Wasn’t Broken
Two drives in my server looked like they were dying in the same week. Both turned out to be fine — arguably better than fine — and the reason is more interesting than a simple failure story.
One was a shingled drive that spent twelve days taking up to ten seconds to answer a single read. The other was a perfectly healthy drive behind a marginal cable that made the parity check report a thousand errors.
This is what the telemetry said, and why the second one is the reason I’ll stop buying desktop-class drives for a machine that is both a NAS and a server.
The array, and the one drive that doesn’t belong
Six 4 TB drives carry the data array, plus two NVMe-class SSDs for cache. Five of the six are NAS-class drives:
| Drive | Recording | Class |
|---|---|---|
| 3 × WD Red Plus 4 TB | CMR | NAS |
| 2 × Seagate IronWolf 4 TB | CMR | NAS |
| 1 × Seagate BarraCuda 4 TB | SMR | Desktop |
The BarraCuda is the odd one out — same capacity, same vendor family as the IronWolf, roughly the same price class when I bought it, but built on shingled magnetic recording and sold as a desktop drive. It’s been the slowest member of the array since the day it went in, and this month it stopped being merely slow.
Incident one: the drive that went quiet
On September 17 at 07:45 I measured a direct read from it: 16 MB took about four seconds — 4.1 MB/s. The same test on an IronWolf in the same chassis returned 167 MB/s. A 32 MB read through the array didn’t finish inside a 60-second timeout.
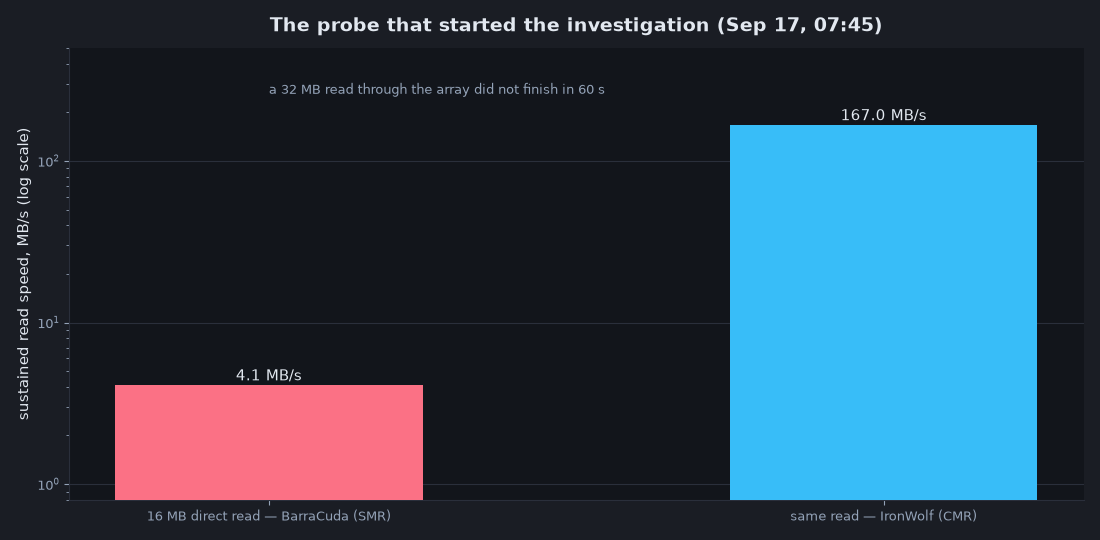
And yet every health indicator said the drive was fine. SMART passed. Zero reallocated sectors, zero pending sectors, zero command timeouts, no error-log entries. Temperature 38 °C. If I’d only looked at SMART, I’d have concluded the drive was perfect and gone looking for a software problem.
The server was already logging per-device IO telemetry every ten seconds, so I went back through a month of it and computed a simple latency metric per drive: device-busy time divided by completed operations. That’s not a perfect latency measurement — it’s what the kernel reports as the device being busy per operation, which includes queueing — but it’s comparable across drives on the same controller, which is exactly what the question needed.
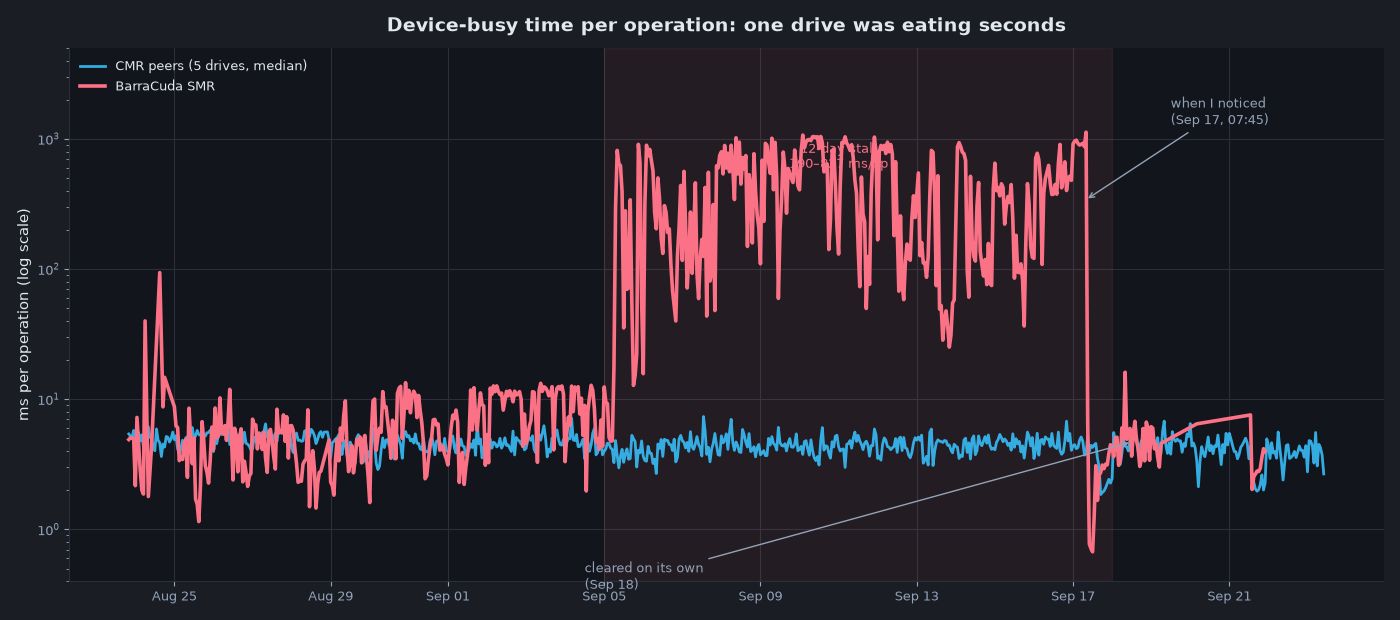
The BarraCuda wasn’t suddenly bad — it was bad for twelve days before I noticed. Its per-operation busy time jumped to 190–827 ms from September 5 onward, while the five CMR peers kept their normal ~4 ms pace. The worst individual operations took 10,001 ms — just over ten seconds on a single read. Across the whole month its mean was 263 ms/op, about 60× the peers’ average, with p99 at 2.5 seconds.
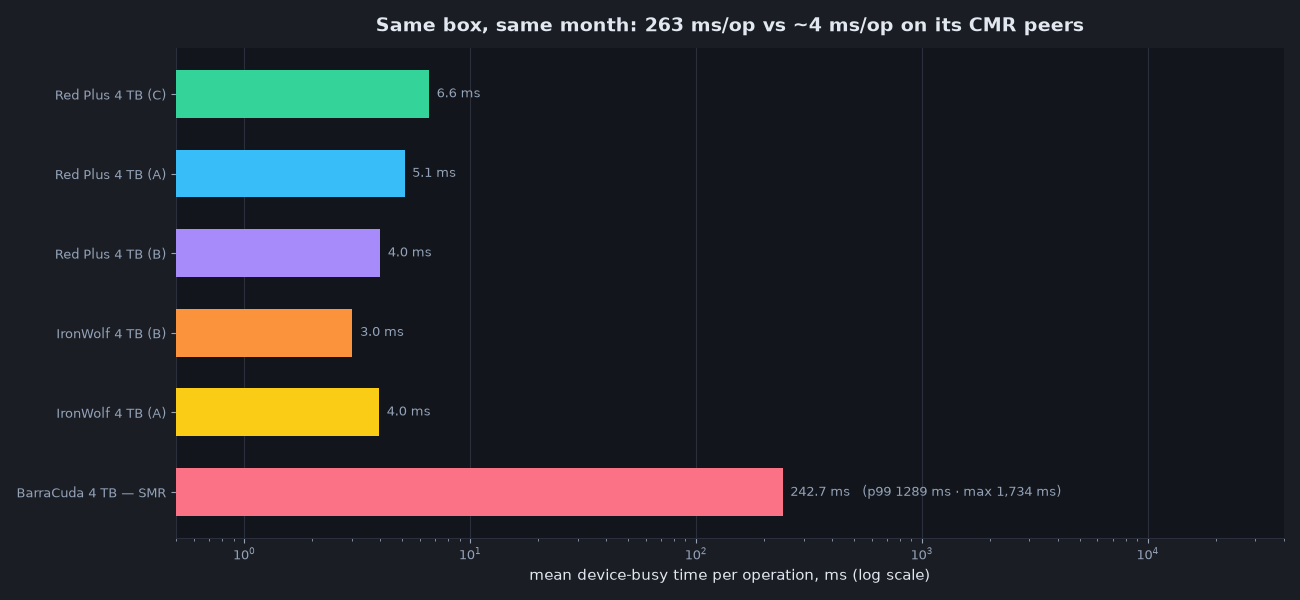
The stall window ended on September 18 — the day after a full parity-check read swept the entire array — and the drive has been back at ~4.7 ms since. I didn’t replace it, didn’t re-seat anything, didn’t power-cycle it; whichever internal process was chewing on the drive simply finished. I can’t prove the parity read helped, and I won’t claim it did. What the telemetry proves is the stall happened — twelve days that never showed up in a single SMART counter.
What SMR is, and why it does this
SMR packs tracks closer together by overlapping them like roof shingles. That gives more capacity per platter at the same cost — which is why manufacturers push it into budget drives. The catch is you can’t rewrite a shingled track without rewriting the track it overlaps, so the drive hides a conventional (CMR) cache on the platter: writes land there fast, and a background process later shuffles them into the shingled zone. Seagate confirms the details on its own “CMR vs SMR” page, and the TrueNAS community’s known-SMR list explicitly identifies the ST4000DM004 as a DM-SMR drive.
That scheme is fine until the cache fills and the drive falls behind. Then the drive spends minutes rewriting whole bands to make room while every command — including reads — queues behind the housekeeping. That’s the 10-second operation. It can also happen after a burst of writes, or when the drive’s internal garbage collection runs long. Drive vendors have shipped SMR into consumer drives without always saying so (Seagate in particular took heat in 2020 for “submarining” SMR into BarraCuda and renamed models).
Why it’s the wrong drive for a NAS that’s also a server
The most defensible use case for SMR is archive: write once, rarely touch, low price per GB. A NAS that’s also a server is the opposite on every axis.
The array’s own maintenance is the worst-case workload. A parity check or a rebuild reads every member of the array at near-sustained speed for hours.
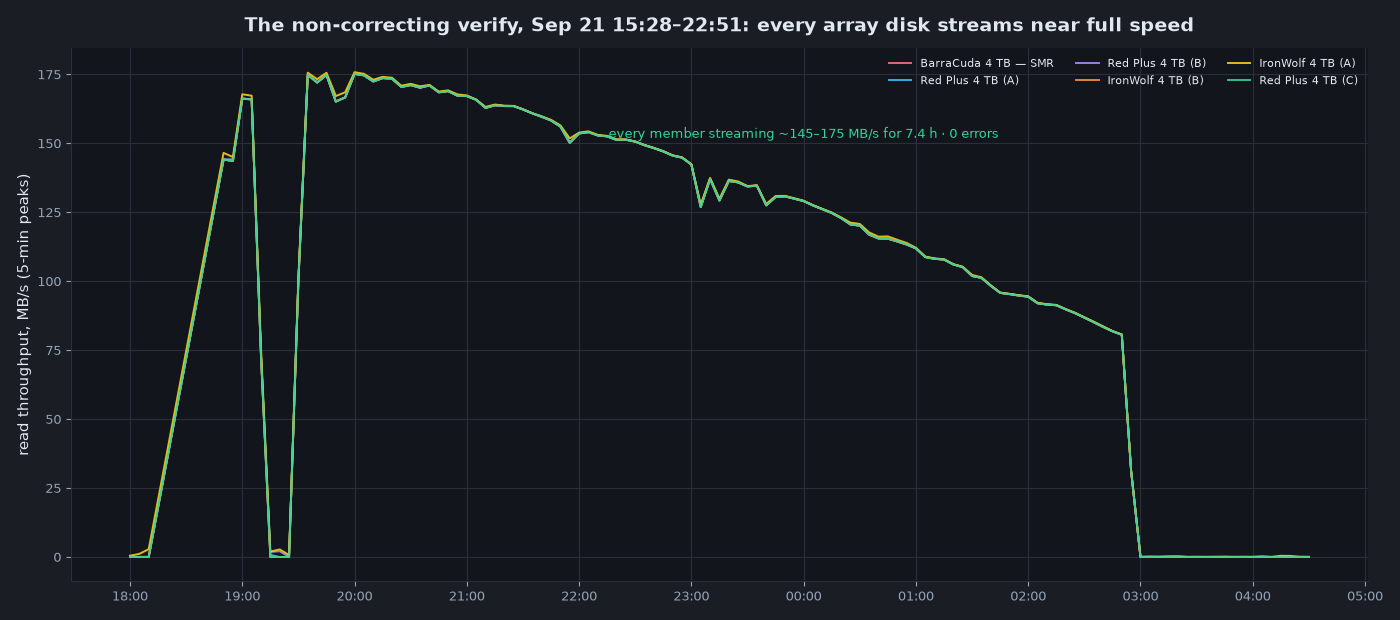
That chart is the non-correcting verify run on September 21 — each of the six array drives streaming at roughly 145–175 MB/s for 7.4 hours straight. The day a drive dies and a rebuild starts, the surviving members do that while also serving normal traffic, for 10–20 hours. An SMR drive that decides to run its housekeeping mid-rebuild will quietly make a rebuild that should take a day stretch into several — or, pre-expansion, stall the whole parity operation.
Containers and VMs are random-IO machines. Databases, photo indexing, metadata writes — these are small scattered writes, precisely what SMR’s cache-and-shuffle design is worst at. My server runs a bunch of them, and every one of those workloads sat on the same 4 TB platter that was answering operations in hundreds of milliseconds — sometimes seconds.
SMR isn’t bad hardware. It’s cheap hardware for a narrow job, and the job I’m giving it is the job it’s worst at.
Keeping it in the array anyway
So why is the drive still there? Because it isn’t broken. Its media is clean, it passes every SMART test, and it’s 4 TB of parity-protected capacity. Pulling a drive out of an array costs a rebuild and a smaller array; the drive being slow doesn’t justify either. Instead I took it out of the paths where it does damage — four changes, all cheap:
1. Took it out of the write path. The array’s shares used the default high-water allocator, which sends new files to whichever disk has the most free space. A freshly added drive is, by definition, that disk — which is how a desktop-class SMR drive ended up as the destination for backups, container app-data and VM disks. Ten of the array’s shares are now explicitly excluded from it, and the container app-data share is pinned to a CMR disk instead. New files can no longer be allocated onto it, so the cache-to-array mover bursts and the scattered container writes that hurt it land somewhere else.
2. Emptied it. It now holds 27 GB out of 3.7 TB — about 1 %. It still contributes its capacity and its read bandwidth behind parity, but it is no longer the destination for anything that matters. (Not every share is excluded — a handful can still allocate to it. The write-heavy ones can’t, and that’s the distinction that counts.)
3. Removed the trigger, not just the symptom. The stall wasn’t spontaneous. On 17 September a scheduled cache-to-array move for a torrent client pushed a 4 GiB write onto that drive: it accepted 531 MiB and then stopped, leaving ~3.8 GB of dirty pages stuck in memory — which blocked reads too, because the array’s stripe had to wait on it. With those shares excluded from the drive, the mover has nowhere on it to send that data in the first place.
4. Gave myself a warning system. Per-disk per-operation latency is now part of the telemetry I keep, with the retention window widened to 180 days — the metric that would have caught this stall twelve days before I noticed it. Alongside it: a rule that any new interface-level error, or a CRC count crossing 10, gets physical attention, and periodic non-correcting parity verifies to prove the array’s parity is actually sound rather than assumed.
What none of that fixes: a rebuild. If that drive ever has to be reconstructed — or has to help reconstruct another member — every disk in the array gets read end to end for hours, and no share setting changes that. The exclusions cut the odds of another multi-day stall; they don’t make the drive the right tool for the job. It’s also worth saying plainly that I didn’t swap it because SMART never gave me grounds for a warranty claim, and the drive stopped misbehaving on its own on 18 September.
Incident two: the disk that really wasn’t broken
In the same week, a different drive set off alarms. The correcting parity check on September 17–18 found and fixed 1,019 errors on one array member — the kind of number that makes you start pricing replacement drives.
Everything about that drive’s media looked clean, though. Its SMART counter for interface-level CRC errors sat at 8 for the entire month — flat, unchanging — and its reallocated, pending and timeout counters were all zero.
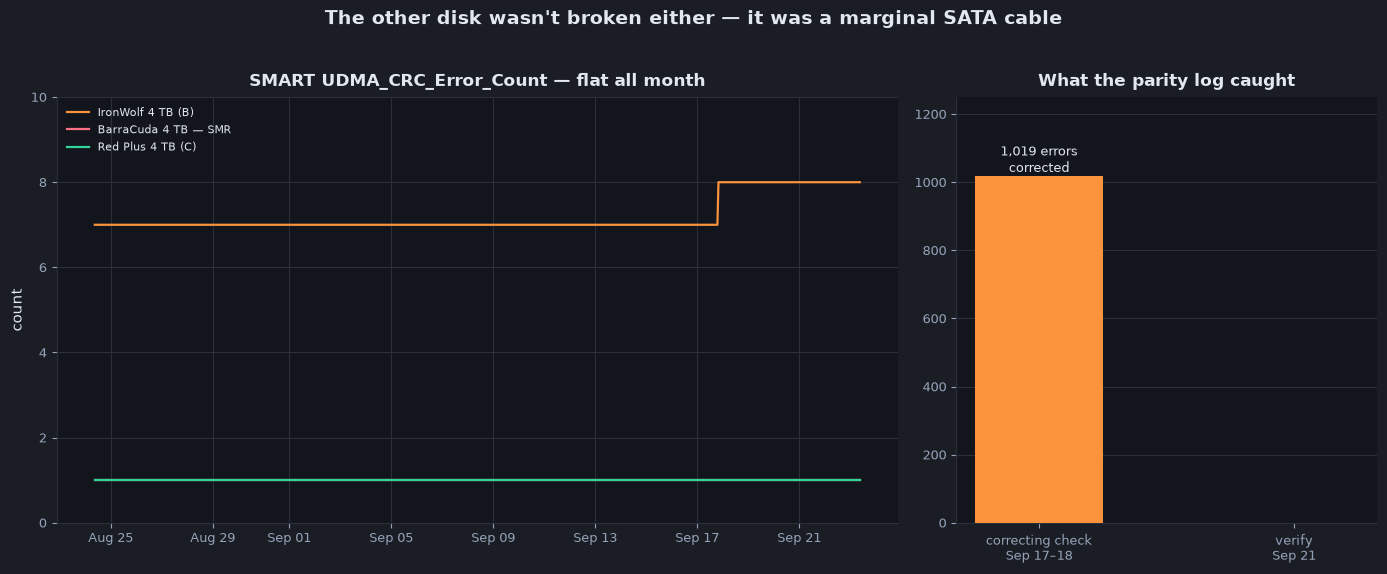
The evidence pointed at the link, not the media: the drive’s own media counters were all zero, the only interface-level counter that had ever moved on that drive was the CRC count, and the fix that ended it was physical — re-seating the SATA connection. That evening’s non-correcting verify then read the whole array, every disk, for seven and a half hours with zero errors.
So the drive wasn’t dying. A connector that had been making imperfect contact was handing the array corrupt reads, and the array’s parity was doing exactly its job: catching them and rebuilding the data. A thousand and nineteen times over.
That’s the part worth internalising: parity didn’t protect my data from a disk failure here — it protected my data from a cable. And the only reason I know the difference is that the parity log said “corrected 1,019” while the drive’s own counters said “nothing to see here”.
The health snapshot that explains both
| Drive | Reallocated | Pending | Timeouts | Temp max |
|---|---|---|---|---|
| BarraCuda 4 TB (SMR) | 0 | 0 | 0 | 38 °C |
| IronWolf 4 TB (A) | 0 | 0 | 0 | 40 °C |
| IronWolf 4 TB (B) | 0 | 0 | 0 | 38 °C |
| Red Plus 4 TB (A) | 0 | 0 | n/a | 36 °C |
| Red Plus 4 TB (B) | 0 | 0 | n/a | 37 °C |
| Red Plus 4 TB (C) | 0 | 0 | n/a | 35 °C |
(The WD drives don’t expose the command-timeout attribute, hence the gaps.)
Six drives, all “healthy”, all cool, zero bad sectors — and one of them was taking ten seconds per read for twelve days while another was picking up a thousand corrected reads from a bad connector. SMART is necessary and nowhere near sufficient. It measures media degradation. It does not measure whether the drive can keep up with the workload, and it doesn’t see the cable at all.
What I’d do differently
- Check the model number before buying, every time. Both Seagate and WD publish CMR/SMR lists, and the community lists are better maintained than the marketing pages. A 4 TB drive is not a 4 TB drive.
- Buy NAS-class CMR for anything that lives in a parity array. The price gap is far smaller than the cost of a rebuild that crawls; the failure mode here is a server that works fine until it suddenly doesn’t.
- Measure latency, not just throughput. During its worst week the BarraCuda still streamed 175 MB/s when the parity check asked for a long sequential read — because sequential streaming is the one thing SMR does well. Interactive workloads died behind it anyway. Throughput charts would have shown nothing wrong.
- If an SMR drive is already in your array, take it out of the write path. Share-level exclusions cost nothing and are reversible; they let the drive keep contributing capacity without letting it become the destination for the writes it handles worst.
- Keep more telemetry history than you think you need. I only saw the twelve-day stall because the data went back far enough. It doesn’t any more by default — which is why the retention window for this telemetry is now 180 days instead of 30.
The honest verdict
SMR drives aren’t a scam. They’re a density trick that trades unpredictable latency for cheap capacity, and that’s a perfectly reasonable deal for an archive drive that writes once and reads rarely. The mistake isn’t the drive’s — it’s putting a drive designed for cold storage inside a machine whose whole job is to serve containers, photos, and parity sweeps all day.
The BarraCuda is the only drive in that array I’d call a design error. The cable was just a cable. Both of them looked like a dead disk in the logs, and neither one was.
Measured on my server’s own per-device IO telemetry (10-second samples, aggregated into 5-minute bins) plus direct read probes, August 23 – September 23, 2026. Per-operation busy time is computed as Δ(device busy time) ÷ Δ(completed operations) from the kernel’s disk statistics — a queue-inclusive latency proxy, comparable between drives on the same controller rather than an absolute request latency. The 1,019 corrected errors and the clean verify are from the array’s parity-check logs. Model numbers are public product information; serial numbers, device paths and array layout are deliberately not included.