Read Part 3
By the end of Part 3 my CPAP database had three things in it: what my CPAP machine recorded every night, where I was each day from Google Takeout, and the weather at those places from Meteostat. I built all of that to answer one question. Do my nights on the machine get worse when it’s colder, or when I’ve been running around more?
It’s been a while since Part 3. This is the answer I have, and why it isn’t the one I was hoping for.
How Much I Was Sleeping
Before comparing anything I checked how long my sessions on the machine ran. Most of them landed between 7 and 8.3 hours. A handful were under 4.
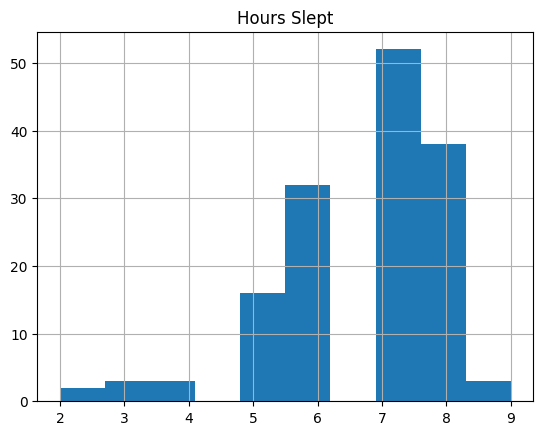
Hours slept per session, from
usage_secin theevent_historytable
The short sessions matter for what comes next. A 3-hour session logs fewer events than an 8-hour one just by being shorter.
Events, Temperature, and Places
I counted the events the machine logged each night from November 8, 2022 to February 4, 2023, and plotted them next to the average daily temperature from Meteostat and the number of places Google had me at that day. The code is in SleepExplorationV2.ipynb.
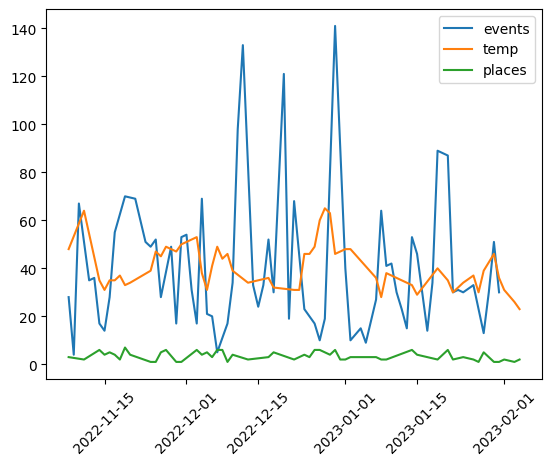
Events per night (blue), average daily temperature in °F (orange), and places visited (green)
Events swing from under 10 to about 140 a night. The three biggest spikes come around December 11, December 20, and December 30. The December 30 spike lands right after the warmest days in the set, in the mid 60s, but the other two show up during ordinary weather. Temperature drifts between the 20s and the 60s, and places visited stays between 1 and 7. Neither one moves with the event count in any way I can see.
With this data, I can’t tie my sleep to the weather or to how much I moved around.
Why the Chart Couldn’t Answer It
Looking at it again three years later, the setup had problems built in.
I counted the wrong thing. The chart counts every row in event_history. That mixes obstructive apneas and hypopneas with flow limitations and snores. The number sleep doctors use is the apnea-hypopnea index (AHI): apneas plus hypopneas per hour of sleep. Under 5 is normal, and getting under 5 is what CPAP is for. A night with 100 flow limitations and 2 apneas is a good night by AHI, and my chart drew it as a bad one.
I didn’t divide by hours. usage_sec was sitting in the same table. A 4-hour night and an 8-hour night can’t be compared on raw counts.
Outdoor temperature isn’t bedroom temperature. Meteostat tells me what it was outside wherever I was. My furnace doesn’t care. When I had two Raspberry Pis logging temperature in my house in September, the dining room stayed between 67.8 °F and 76.3 °F for a month while the weather outside did whatever it wanted. That wasn’t the bedroom and it wasn’t winter, but my guess is that 25 °F and 65 °F days outside meant roughly the same bedroom.
Places visited has the same problem. It counts the stops Google logged, not how active I was.
What the Research Says
I went looking for whether temperature should matter at all. It does, a little, and the studies don’t even agree on the direction.
- Valham et al., Sleep, 2012 put 40 adults with untreated sleep apnea in rooms at 16 °C, 20 °C, and 24 °C (about 61, 68, and 75 °F). Obstructive AHI averaged 30 in the cold room and 24 in the warm one. Colder was worse.
- A 2024 study in Science Bulletin used sleep apnea screening from smart wearables on 51,842 people across 313 Chinese cities. Every 10 °C rise in outdoor temperature added 0.70 events per hour. Hotter was worse.
So a large temperature change moves AHI by somewhere between less than one and about six events an hour, depending on who you ask. Those are averages across a lot of people. My chart was one person, about three months, and raw counts that swing by 100 or more from one night to the next. An effect that size was never going to show up in it.
Conclusion
I couldn’t find a link between my sleep and the weather or my travel, and the research says I shouldn’t have expected to see one with this setup. Whatever caused my bad nights was bigger than anything the temperature was doing.
If I run this again, I’d start from AHI per night instead of raw counts, and pull mask leak from the details data. The machine records leak every two seconds, and it’s the first thing I’d check on the spike nights. For temperature I’d put one of the Pi sensors in the bedroom instead of asking Meteostat. All of that means pulling fresh data off the SD card, since this set stops in February 2023.